Appearance
Quick Start - Web GIS SDK
How to Use
Step 1: Install via npm
bash
npm install gis-engineStep 2: Import gis-engine and static resources in your code
javascript
import * as ge3d from 'gis-engine';
import 'gis-engine/dist/ge3d.css';
That's it! With just these two simple steps, we can use gis-engine in our code ✌️
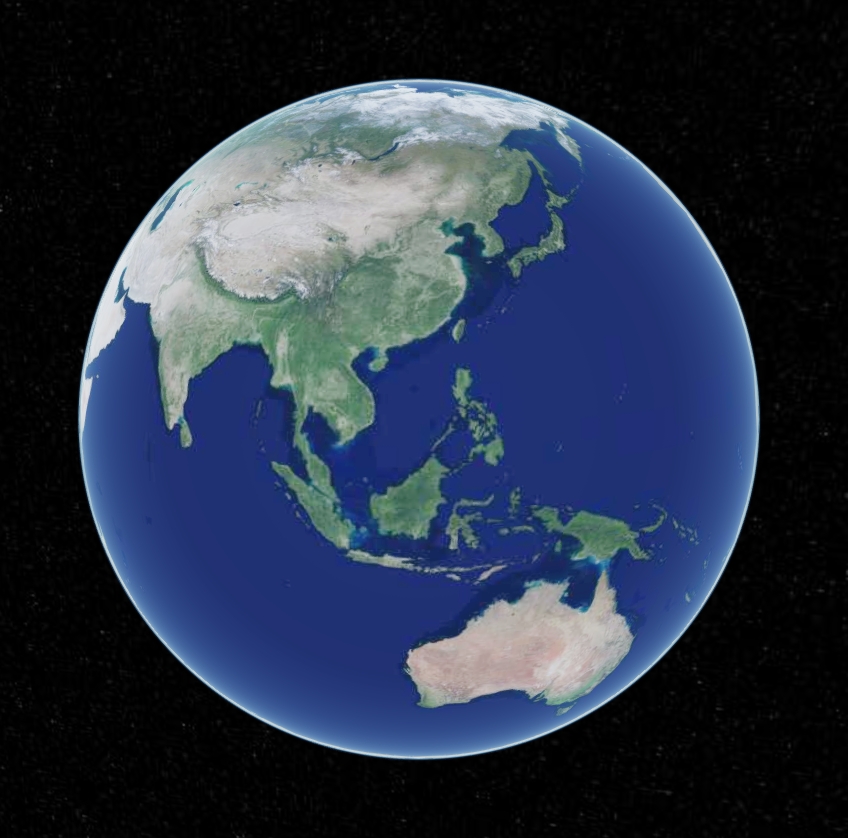
Now let's create an earth to see how it works!
javascript
const core = new ge3d.Core("cesiumContainer", {
  "scene": {
    "center": {
      "lat": 39.9087,
      "lng": 116.3975,
      "alt": 45187,
      "heading": 0,
      "pitch": -45
    },
    animation: true, // Whether to create animation widget, bottom left gauge
    timeline: false, // Whether to show timeline control
    fullscreenButton: true, // Bottom right fullscreen button
    vrButton: true, // Bottom right VR virtual reality button
    geocoder: true, // Whether to show geocoder control
    sceneModePicker: true, // Whether to show projection mode control
    homeButton: true, // Return to default view button
    navigationHelpButton: true, // Whether to show help information control
    navigationInstructionsInitiallyVisible: true, // Whether to automatically show before user explicitly clicks button
    infoBox: true, // Whether to show information when clicking features
    selectionIndicator: true, // Whether to show green box when selecting models
    shouldAnimate: true, // Whether to enable animation
    showRenderLoopErrors: true, // Whether to show error popup information
    baseLayerPicker: false, // Map base layer
  },
  "baseImages": [
    {
      "id": 'googleLayerId',
      "name": "Google Imagery",
      "type": "google",
      "layer": "img_d",
      "show": false
    },
    {
      "id": 'tdtLayerId',
      "name": "Tianditu Imagery",
      "type": "tdt",
      "layer": "img_d",
      "show": true
    }
  ]
});
Effect as shown below:
Product Manual
1. Overview
GISEngine is a 3D visualization engine based on WebGL technology. It enables high-performance 3D rendering on web pages without plugins, supports multi-threaded processing, and ensures efficient loading and dynamic display of large-scale geographic data. It supports 3D visualization of various spatiotemporal data types, presenting imagery, elevation, vector, real-world scenes, and 3D models with 3D visualization effects. It supports multiple standard services and data integration such as OGC, TMS, MapBox, and 3DTiles, enabling seamless integration with various map service provider data sources. It supports vector data plotting and management: supporting point, line, polygon, volume, and model plotting, while providing unified API calls and style settings, supporting GeoJSON format data import and export.
It is suitable for geographic information system development, urban planning, environmental monitoring, disaster warning, and other fields. It can be used for intuitive display of urban planning schemes, real-time display of environmental changes, disaster simulation prediction, traffic flow monitoring, and other specific scenarios.
2. Component Listing and Functional Description
2.1 Image Visualization Component
Function: Raw raster data can be tiled through raster pyramid plugins and published as WMS or WMTS tiles through geoserver, then loaded through the GISEngine engine. The GISEngine engine's image visualization component allows users to load and display various raster data formats such as satellite imagery and aerial photographs. Users can adjust image parameters such as hue, saturation, gamma correction, transparency, contrast, and brightness in real-time to meet different research and analysis needs.
Features: The component has built-in multiple color mapping schemes that can transform complex image data into easily understandable visual effects. Additionally, users can customize color mapping to highlight specific geographic features or regions.
2.2 Vector Visualization Component
Function:
- The vector visualization component supports loading and drawing point, line, and polygon vector data. Users can set different symbol styles such as color, size, and shape for different geographic features based on vector data attribute information.
- Vectors support editing functionality, allowing any point of a polygon to be edited as a new node. Vector data can also be moved as a whole.
- Supports various effects such as dynamic points, flowing lines, flashing, scanning, etc. These effects can be combined with vector data to enhance the expressive capability of application scenarios.
- For large-scale vector data, GISEngine provides optimization methods such as combined rendering (combine rendering) to ensure smooth operation and efficient display even with large data volumes.
Features: The component provides rich symbolization options, allowing users to customize symbol styles as needed to achieve data classification and hierarchical display. Additionally, the component supports dynamic updates and interactive operations of vector data, such as click queries and area selection.
2.3 3D Visualization Component
Function: The 3D visualization component allows users to load and display 3D terrain, buildings, and other model data. Users can change model position and state through operations such as rotation, scaling, and translation, while observing 3D scenes from all angles and adjusting rendering parameters such as lighting and shadows in real-time to achieve more realistic visual effects.
Features: The component supports LOD (Level of Detail) technology, automatically adjusting model detail levels based on viewing distance to balance rendering quality and performance. Additionally, the component provides rich interactive features such as flight roaming and collision detection, enabling users to explore 3D scenes more deeply.
3. Supported Visualization Data Formats
- Image Data: Supports common raster data formats such as GeoTIFF, JPEG2000, PNG, etc.
- Vector Data: Supports vector data formats such as Shapefile, GeoJSON, KML, etc.
- 3D Data: Supports 3D model data formats such as obj, osgb, las, b3dm, tiff, fbx, gltf, glb, 3D Tiles, etc.
4. Visualization Framework and Rendering Performance Description
4.1 Visualization Framework
- This product is built on a high-performance visualization framework based on WebGL technology. WebGL is a cross-platform graphics API that allows developers to use JavaScript and OpenGL ES to render complex graphics and animations on web pages.
- The framework adopts a modular design, splitting various functional components into independent modules, reducing system coupling and improving code maintainability and extensibility.
4.2 Rendering Performance
- Through optimization of rendering pipelines, reduction of draw calls, and rational use of caching, this product achieves efficient rendering performance. Even when processing large-scale data, it maintains smooth interactive experience.
- For large-scale vector data, GISEngine provides optimization methods such as combined rendering (combine rendering) to ensure smooth operation and efficient display even with large data volumes.
- The component supports asynchronous loading mechanisms, enabling on-demand data loading to avoid performance issues caused by loading too much data at once. Additionally, the component provides data compression and simplification functions, further improving rendering efficiency.
5. Technical Implementation Description
5.1 Image Visualization Implementation
- The image visualization component adopts a quadtree structure to manage image data. By dividing image data into tiles of multiple levels and resolutions, it achieves multi-level, multi-resolution image loading and display.
- The component has built-in multiple color mapping algorithms such as linear mapping and logarithmic mapping. Users can choose appropriate algorithms for color mapping based on needs. Additionally, the component supports user-defined color mapping schemes to meet different research and analysis needs.
5.2 Vector Visualization Implementation
- The vector visualization component utilizes WebGL's vertex buffer objects and index buffer objects to efficiently draw vector graphics. By optimizing drawing processes and reducing unnecessary draw calls, it improves rendering efficiency.
- The component implements a symbolization engine that can dynamically set symbol styles based on vector data attribute information. Users can highlight specific geographic features or regions by setting symbol parameters such as color, size, and shape.
5.3 3D Visualization Implementation
- The 3D visualization component is based on WebGL's shader language to write custom renderers, achieving highly realistic 3D scene rendering. By writing custom shader code, it can control rendering parameters such as lighting, shadows, and texture mapping to achieve more realistic visual effects.
- The component adopts a scene graph structure to organize 3D model data. By dividing model data into multiple nodes and sub-nodes, it achieves efficient management and rendering of complex scenes. Additionally, the component supports LOD (Level of Detail) technology, automatically adjusting model detail levels based on viewing distance to balance rendering quality and performance.
6. Summary
GISEngine is a 3D visualization engine based on WebGL technology, mainly used for 3D client development. GISEngine is based on WebGL for hardware-accelerated graphics, supporting cross-platform, cross-browser 3D visualization. Based on Cesium optimization and B/S architecture design, the platform can run efficiently in browsers without installation or plugins.
GISEngine supports various spatiotemporal data in 3D scene visualization, including imagery, elevation, vector, real-world scenes, 3D models, etc., and can realistically present various types of 3D scenes such as 3D terrain, oblique photography, BIM, and artificial precision models. In data plotting and management, it supports plotting and management of various vector data such as points, lines, polygons, volumes, and models, providing unified API calls and style settings, supporting standard GeoJSON format data import and export. The GISEngine engine supports multiple standard services and data integration such as OGC, WMS, WMTS, TMS, VectorTiles, MapBox, 3DTiles, etc., facilitating integration with various data sources.
The GISEngine engine can be widely applied in smart city systems, smart park systems, metaverse systems, digital twin systems, and other fields, providing customized 3D visualization solutions for different industries. GISEngine is a feature-rich, high-performance, easy-to-develop and customize 3D visualization engine suitable for multiple industry fields.